Quantcast
Channel: Dr. Smith's ECG Blog
Viewing all 1684 articles
Browse latest View live

Outstanding General Lecture on the ECG in Acute MI: 34 minutes by Dr. K. Wang.

$
0
0


ECG Manifestations of Myocardial Infarction from HQMedEd on Vimeo.
cited previous videos:
Ta Wave (Atrial Repolarization Wave), how it affects the ECG interpretation
http://hqmeded.com/ta-wave-atrial-repolarization-wave-2/

Usefulness of PVCs
http://hqmeded.com/usefulness-of-pvcs-2/

ST Elevation in Conditions other than Acute MI
http://hqmeded.com/st-elevation-in-conditions-other-than-acute-mi-2/

K. Wang, MD
Clinical Professor of Medicine
Cardiology Division
University of Minnesota

med.umn.edu/cardiology/faculty/wang/home.html

5 hours of chest pain. How acute is the STEMI?

$
0
0
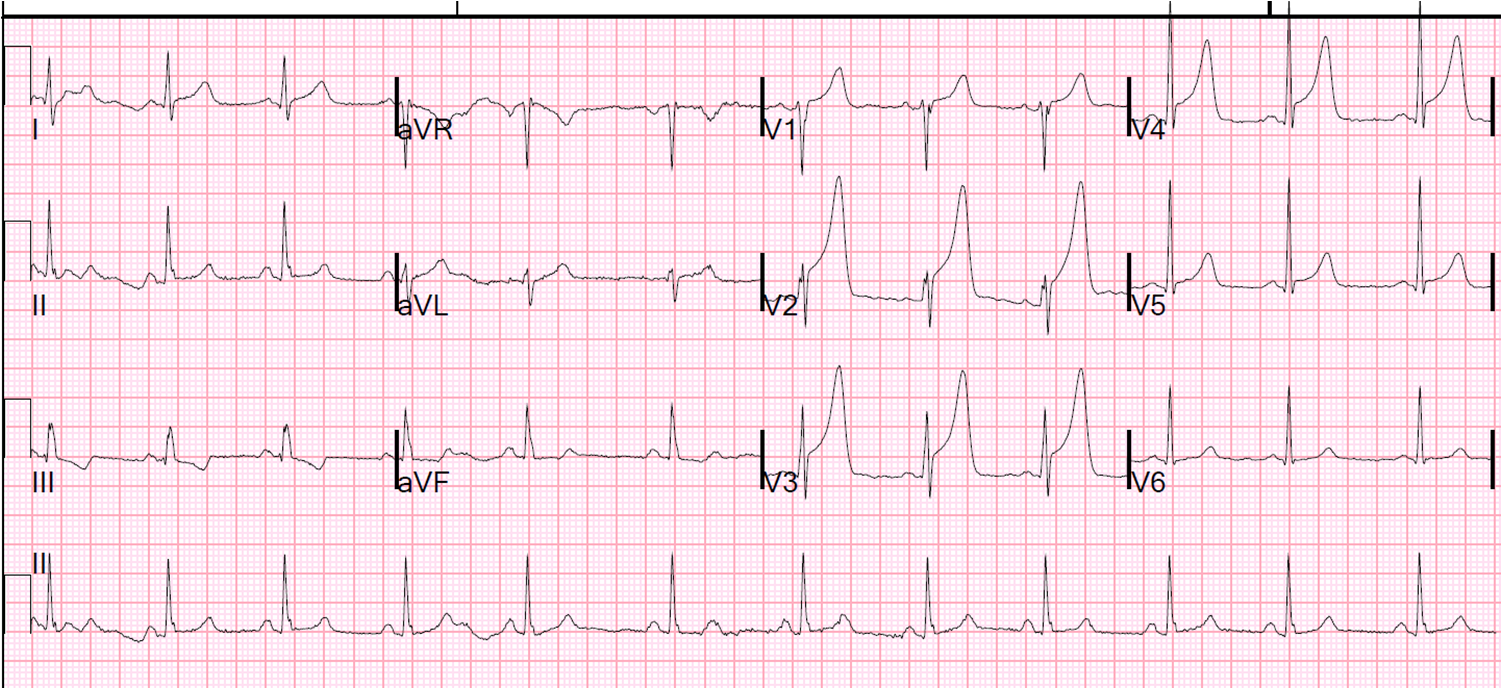
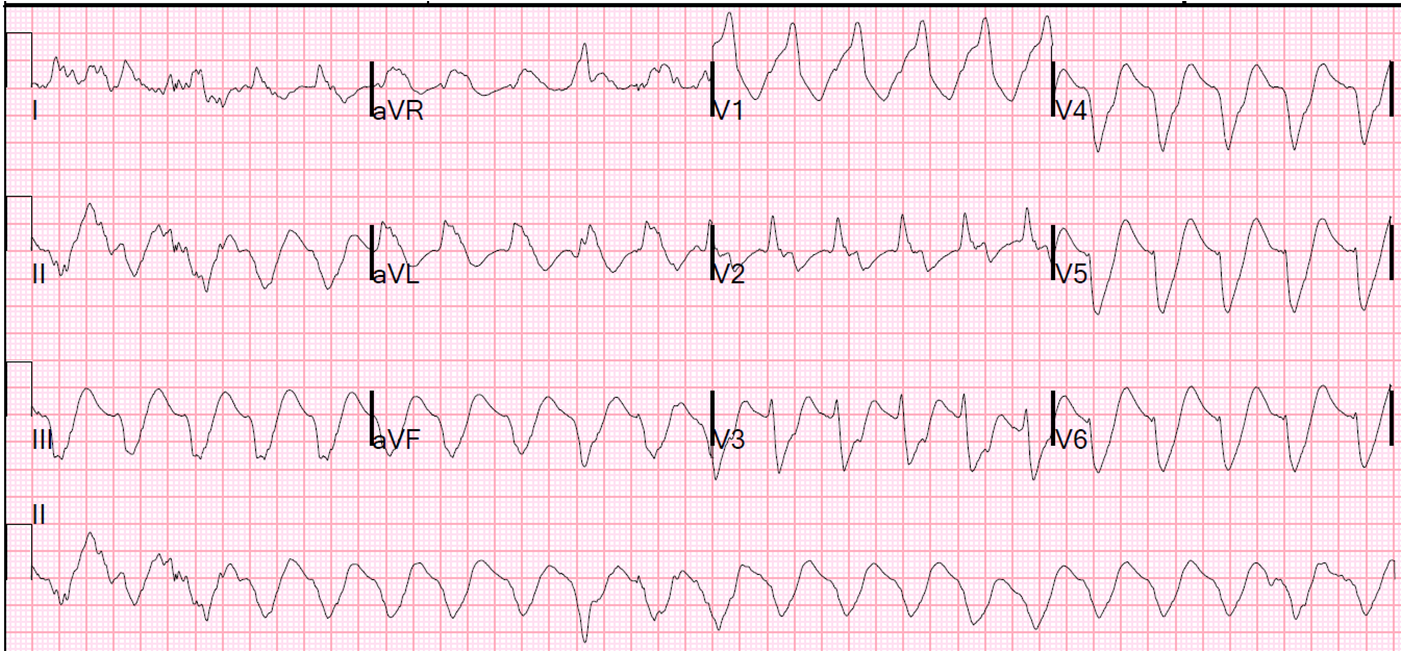
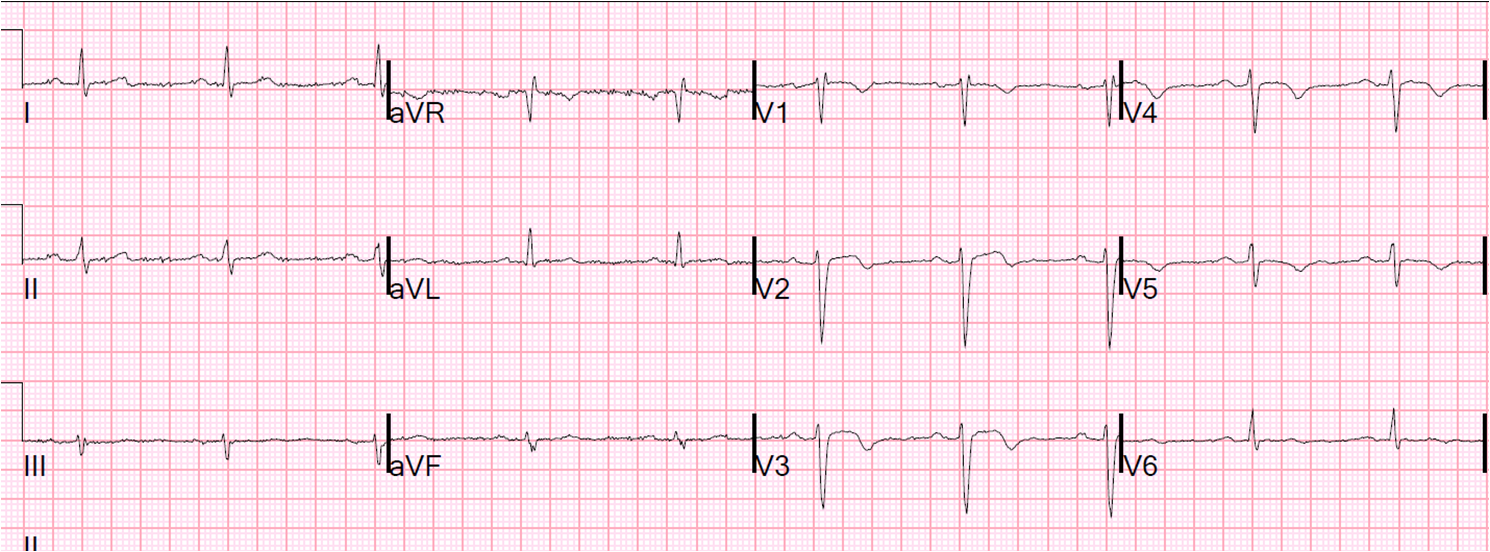
A male is his 30's with h/o HTN presented after 6 hours of chest pain.  The pain was crushing and substernal, associated with nausea, vomiting, and diaphoresis, radiating to his back, 10 out of 10 in intensity, the "worst pains ever experienced". He described the sensation as "an elephant sitting on chest".  Here is his EKG by EMS:


Obvious anterior STEMI with very large T-waves.  Is this consistent with 5 hours of injury?


The cath lab was activated prehospital.  Patient received 324 aspirin and 3 nitroglycerin tablets sublingually prior to arrival to the ED with mild improvement of pain.
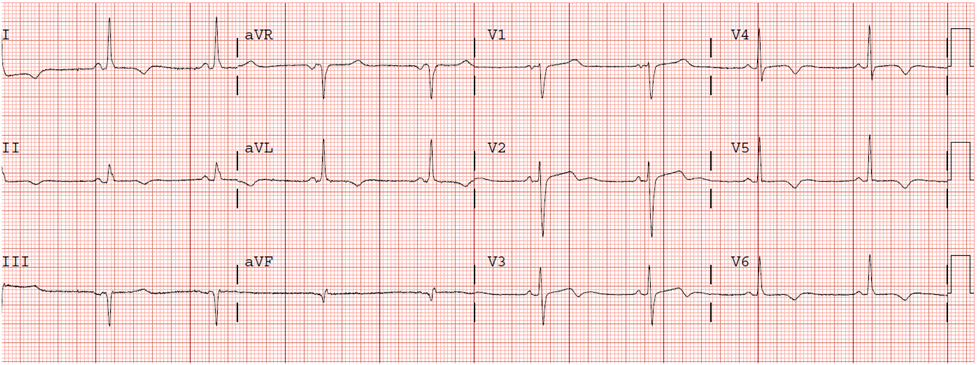
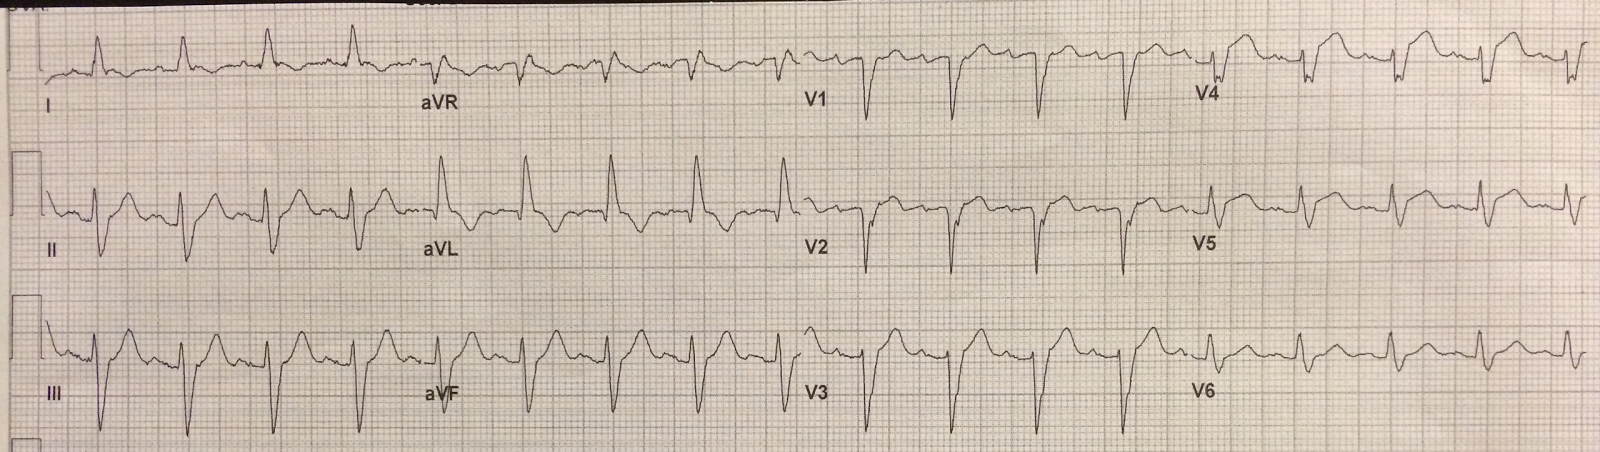
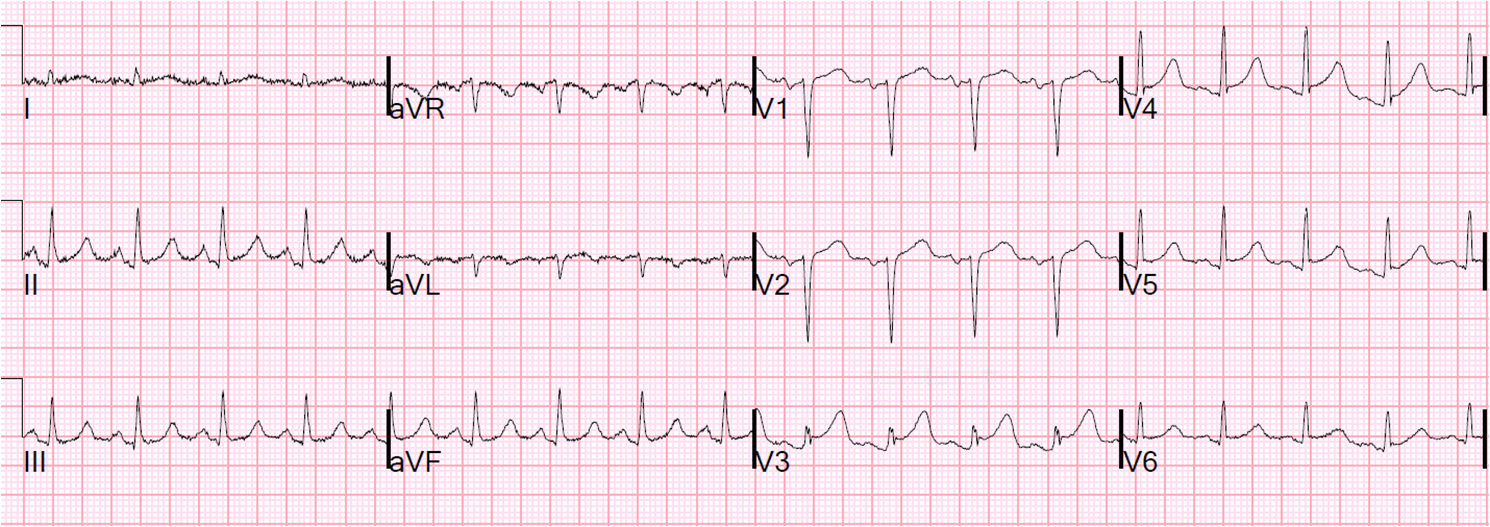
Here is the ED ECG:
Very hyperacute T-waves and ST elevation.  Somewhat diminished after Nitroglycerine.


Suppose you were at a small hospital that only has thrombolytics.  You have the option of giving thrombolytics or of transferring to a PCI capable hospital.  The Door (small hospital) to Balloon (PCI hospital) time will be 90 minutes.

Should you give thrombolytics?

It is well known that thrombolytics work best with fresh thrombus, within 2 hours of onset of occlusion (Steg et al., see reference 8 below).  But this patient has had 5 hours of chest pain.

However, the ECG shows a very high level of "Acuteness," as demonstrated by 1) the size of the T-wave 2) the amount of ST elevation and 3) the absence of Q-waves.   Hyperacute T-waves are present when there is a large amount of viable, salvageable, myocardium.  As the myocardium infarcts (Q-waves), rather than being "injured," (as manifested by ST elevation and hyperacute T-waves), the size of the T-wave diminishes, and also the ST elevation diminishes and Q-waves begin to form (although in anterior STEMI Q-waves may form very early due to ischemia of the conducting system, not infarct!). 

The most specific sign of a very early MI are hyperacute T-waves.

We know that ACS is a very dynamic process, with opening and closing of the vessel.  The time of onset of chest pain is not a good determinant of the time of onset of irreversible ischemia (infarct).  We also know that pain is not a very reliable indicator of reperfusion/reocclusion.  Studies of patients on 12-lead ST segment monitors shows rise and fall of ST segments while patients are asymptomatic.

So, this ECG is very hyperacute.  Almost all the myocardium at risk is viable and can be salvaged.  The thrombus has been forming and lysing spontaneously, which means that it is fresh thrombus, and very amenable to lysing with tPA or TNK-tPA.

If I saw this patient, assuming there are no contraindications, I would give thrombolytics (fibrinolytics) and transfer. 

When the patient arrives at the PCI-capabel hospital, if there is no reperfusion, as measured by less than 50% ST-segment resolution in the single lead with maximum elevation, or clinical evidence of failed reperfusion within 90 minutes after fibrinolysis, then rescue coronary intervention can be performed.  See this article in the New England Journal.

Outcome

The patient went for angiogram/PCI, and a 100% mid-LAD occlusion was found and opened.

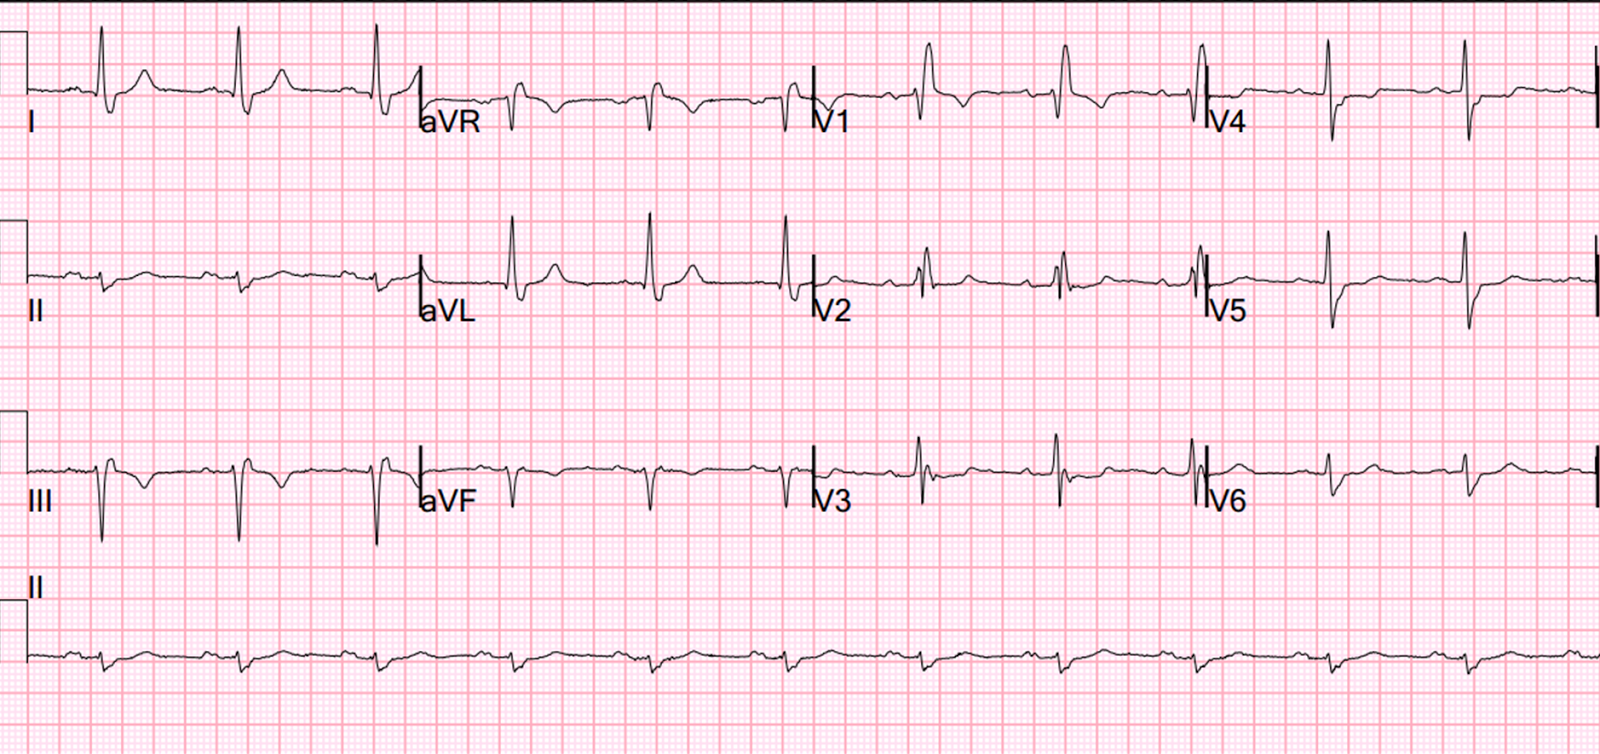
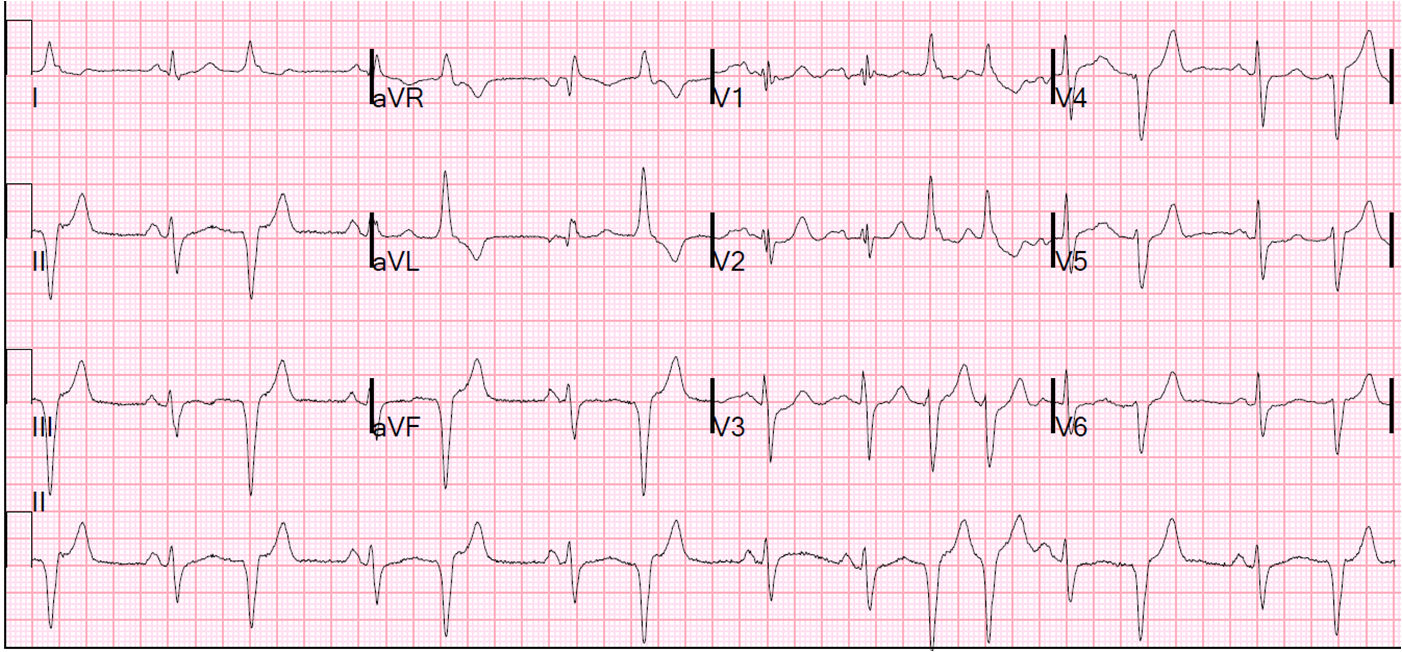
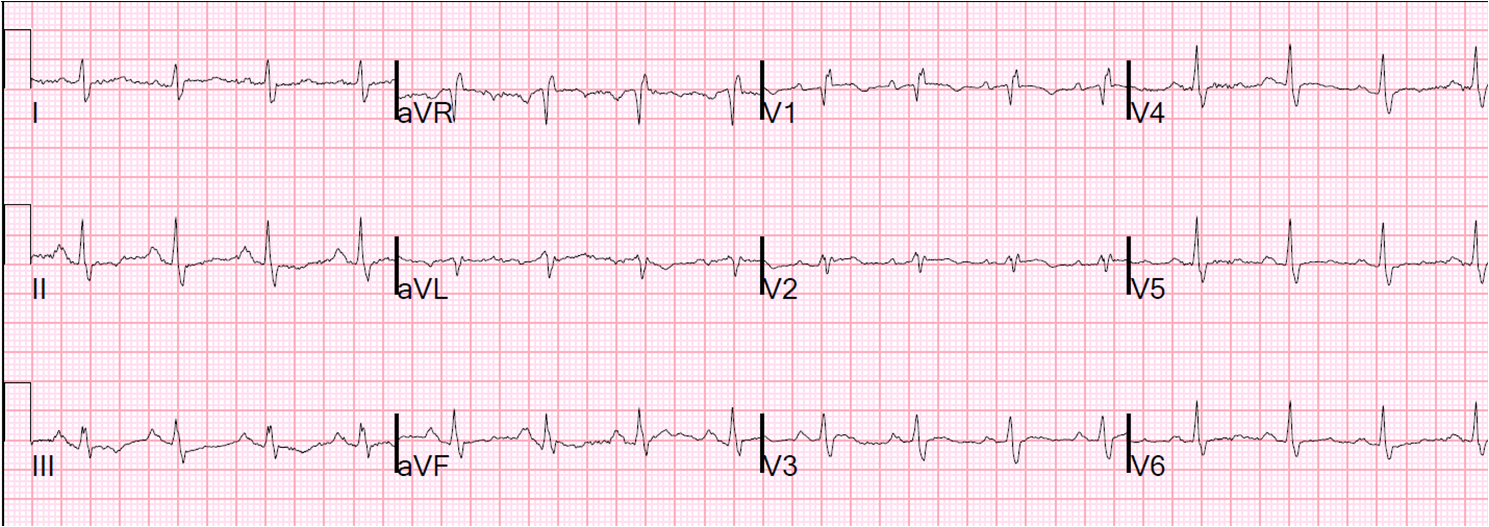
The peak troponin I was 0.9 ng/mL (very low).  The ECG the next day is here:
There is subtle Wellens' waves in V2 and V3. These waves are signs of infarction.  (It is my theory that Wellens' is simply spontaneously reperfused anterior STEMI in which the ST elevation is never recorded.  This demonstrates this phenomenon well).


Echocardiogram next day: There was a mild antero-apical wall motion abnormality.  The convalescent echo, which is done after recovery of "stunned" myocardium at 4-6 weeks, will almost certainly be normal.

Of the significant myocardium at risk in the anterior wall, almost all of was salvaged because of the hyperacute nature of the injury, as manifested by huge T-waves, and the rapid reperfusion.


Lesson:

1. The ECG is a better indicator of acuteness than the time since onset of chest pain.
2. When the ECG is very acute, thrombolytics are beneficial, and waiting for PCI has much less benefit, and probably relative harm.


Relevant references, in addition to the New England Journal article above


1.            Engblom H, Strauss DG, Heden B, et al. The evaluation of an electrocardiographic myocardial ischemia acuteness score to predict the amount of myocardial salvage achieved by early percutaneous coronary intervention Clinical validation with myocardial perfusion single photon emission computed tomography and cardiac magnetic resonance. J Electrocardiol 2011;44(5):525-32.
2.            Armstrong PW, Fu Y, Westerhout CM, et al. Baseline Q-wave surpasses time from symptom onset as a prognostic marker in ST-segment elevation myocardial infarction patients treated with primary percutaneous coronary intervention. J Am Coll Cardiol 2009;53(17):1503-9.
3.            Sejersten M, Ripa RS, Maynard C, et al. Timing of ischemic onset estimated from the electrocardiogram is better than historical timing for predicting outcome after reperfusion therapy for acute anterior myocardial infarction: a DANish trial in Acute Myocardial Infarction 2 (DANAMI-2) substudy. Am Heart J 2007;154(1):61 e1-8.
4.            Engblom H, Heden B, Hedstrom E, Wagner G, Arheden H. ECG Estimate Of Ischemic Acuteness and Time from Pain Onset for Predicting Myocardial Salvage in Patients Undergoing Primary Percutaneous Coronary Intervention. AHA Abstract 2404. Circulation 2007;116(Suppl II):II_528.
5.            Wong CK, Gao W, Raffel OC, et al. Initial Q waves accompanying ST-segment elevation at presentation of acute myocardial infarction and 30-day mortality in patients given streptokinase therapy: an analysis from HERO-2. Lancet 2006;367:2061-7.
6.            Gersh BJ, Stone GW, White HD, Holmes DR, Jr. Pharmacological facilitation of primary percutaneous coronary intervention for acute myocardial infarction: is the slope of the curve the shape of the future? JAMA 2005;293(8):979-86.
7.            Taher T, et al. Aborted myocardial infarction in patient with ST segment elevation: Insights from the Assessment of the Safety and Efficacy of a New Thrombolytic Regimen-3 Trial Electrocardiographic Substudy. J Am Coll Card 2004;44:38-43.
8.            Steg PG, Bonnefoy E, Chabaud S, et al. Impact of time to treatment on mortality after prehospital fibrinolysis or primary angioplasty: data from the CAPTIM randomized clinical trial. Circulation 2003;108(23):2851-6.
9.            Heden B, Ripa R, Persson E, et al. A modified Anderson-Wilkins electrocardiographic acuteness score for anterior or inferior myocardial infarction. Am Heart J 2003;146(5):797-803.
10.         Corey KE, Maynard C, Pahlm O, et al. Combined historical and electrocardiographic timing of acute anterior and inferior myocardial infarcts for prediction of reperfusion achievable size limitation. Am J Cardiol 1999;83(6):826-31.
11.         Hochrein J, Sun F, Pieper KS, et al. Higher T-wave amplitude associated with better prognosis in patients receiving thrombolytic therapy for acute myocardial infarction (a GUSTO-1 substudy).  Global Utilization of Streptokinase and Tissue plasminogen activator for Occluded Coronary Arteries. Am J Cardiol 1998;81(9):1078-84.
12.         Wilkins ML, Pryor AD, Maynard C, et al. An electrocardiographic acuteness score for quantifying the timing of a myocardial infarction to guide decisions regarding reperfusion therapy. Am J Cardiol 1995;75(8):617-20.
13.         Anderson ST, Wilkins M, Weaver WD, Selvester RH, Wagner GS. Electrocardiographic phasing of acute myocardial infarction. J Electrocardiol 1992;25 Suppl:3-5.

45 year old with chest pain

$
0
0
A 45-year-old male was in his usual state of health until three hours prior to arrival, when he developed left-sided chest pressure with radiation to the neck while walking. His pre-hospital ECG is identical to the first emergency department ECG shown in Figure 1. Based on this, the paramedics activated the cath lab, administered nitroglycerin, and the pain resolved.

There is at least 2-mm ST-elevation at the J-point in leads V2 and V3, but the morphology of the T-wave is typical of early repolarization (slow upstroke, fast downstroke). There is minimal ST elevation in leads I, aVL, V5, and V6. There is no inferior ST-depression, no upward convexity, no precordial T-wave inversion, no Q-waves, and no terminal QRS distortion.  There is some lateral ST elevation also: V5, V6, I, aVL, although none of it unambiguously diagnostic.

This is when the Early Repolarization vs LAD Occlusion Equation can be applied – STE60V3 is 4 mm, QTc is 416ms, and RA-V4 is 15mm. Plugging these values in yields 23.753. Being > 23.4, the equation points to STEMI. The specificity of the rule is not perfect, but a value above 23.4 should at least prompt you to aggressively evaluate the patient.


As for the patient’s clinical course, his chest pressure resolved. A bedside emergency department echocardiogram (not a formal echo) reportedly showed no wall motion abnormality. The equation was not used. The cath lab was de-activated. A repeat ECG showed less ST-elevation:

In the second ECG, V2-V5 have less ST-elevation and the T-waves are smaller. It appears normal, different from the presenting ECG.  This apparently was not noticed, or its diagnostic significance was not appreciated.

An application of the Early Repolarization vs LAD Occlusion Equation has equivocal results, depending on whether the STE60V3 is measured at 1.5 or 2.0 mm. Nevertheless, the change shows that the previous ECG was indeed due to acute coronary syndrome (ACS).


Remember – not all ACS has a positive troponin! When negative, it is – of course – called “unstable angina.” It usually presents with a normal or nonspecific ECG, with ST-depression, or T-wave inversion – but unstable angina may also present with transient ST-segment elevation. Perhaps more disgruntling, transient ST-elevation does not always result in a positive troponin. The ischemia may resolve so quickly that there is both no wall motion abnormality and the troponin is negative!

With the advent of high-sensitivity troponin in the future, perhaps such cases will become more rare. But this increased sensitivity may come at the expense of worse specificity, or more false positive troponins.

The patient ruled out for acute MI with serial troponins remaining < 0.04 ng/ml (using a sensitive troponin assay). And so the patient was discharged. Yet 13 days later, he again presented with chest pain that again resolved. Another ECG was done after resolution of pain, as seen in Figure 3.

There is new T-wave inversion in I, aVL, V4-V6. There is terminal T-wave inversion (biphasic) in V2 and V3, but complicated by the U-waves seen in these leads. This T-wave inversion represents a form of Wellens’ syndrome, indicating spontaneous reperfusion of a brief left anterior descending coronary occlusion.

This time troponin was positive, and the patient underwent coronary angiography, which showed severe subtotal left anterior descending artery disease and 70% left main disease. He underwent coronary artery bypass surgery.

Lessons

1. This case illustrates the importance of paying close attention to the ECG and its evolution. The initial ECG is extremely difficult to differentiate from early repol, though the formula did so handily.  But the diagnosis is much easier if one pays attention to the change on the subsequent ECG. With the formula applied, this patient’s ACS could’ve have been diagnosed earlier.  He could easily have died in spite of a negative troponin.

2. Serial negative troponins do not rule out ACS.  One still must pay attention to the ECG.

3. If a formal echo had been done the next day, it most likely would have been normal as well: stunning in such cases resolves quickly.  See this caseAnd this case.


K. Wang Video: Simple Electrophysiologic Characteristics of the Conduction System

Paroxysmal SVT (PSVT) that repeatedly recurs in spite of successful conversion with adenosine

$
0
0
An elderly male complained of dyspnea.  His pulse was regular at just under 150.  BP was 110/70.  There was no evidence of shock or pulmonary edema.  Here is his ED ECG:
There is a very rapid, wide complex tachycardia (QRS = 150 ms).  There are no P-waves before the QRS's.  There is a definite Right Bundle Branch Block and Left Anterior Fascicular Block pattern, so this is not VT.  
The bifascicular block was new.  It could be a new block, or a rate-related BBB
 If you look closely, you can see the inverted (retrograde) P-waves.
(See annotated ECG below, with arrows pointing to inverted P-waves) 
It is clearly SVT with aberrancy.
See arrows pointing to retrograde P-waves


He was given 6 mg of adenosine, and converted to sinus rhythm for about 20 seconds, then reverted back to PSVT.

This was repeated with the same results.

What would you do?


Farther below is what we did (skip the rationale for now, if you already know the pathophysiology of PSVT).  The rationale for management cannot be fully understood without the following.  Here is a good review article in the New England Journal (free full text).

Anatomy of PSVT: Most PSVT is AVNRT (AV nodal re-entrant tachycardia), with the re-entrant circuit in the AV node ("dual AV nodal pathways).  (The remainder is due to an accessory pathway such as WPW and to atrial tachycardia).    In AVNRT, there are two pathways within the node which have different conduction speeds.  In addition, the fast pathway has a long refractory period and the slow pathway has a short refractory period.

Sinus Rhythm: Normally, a sinus beat gets to the dual pathways and travels down both: it gets down the fast pathway quickly and then proceeds both down the HIS bundle and up the slow pathway.  As it travels up the slow pathway, it meets the impulse coming down the slow pathway from above and they both stop each other.

Initiation and propagation of PSVT: 

The common form of the arrhythmia is known as "slow-fast AVNRT".  It is initiated by a premature beat, usually a premature atrial beat (PAB, or more commonly known as PAC), and much less often due to a premature junctional or ventricular beat.

If that premature beat arrives at the AV node when the fast pathway is still refractory, it terminates there. And if it arrives at just the right time, when the slow pathway is no longer refractory (the refractory period is shorter than that of the fast pathway), then it can proceed down that slow pathway.  It then will travel to the bundle of HIS and activate the ventricles.  But it will also go retrograde up the fast pathway.  (The fact that it made its way down the slowpathway gave the fast pathway time to recover from its refractory period).

If you happen to witness the PAB, you will notice that it has a longer PR interval than the sinus beats because it is conducting through the slow pathway.

Now the beat goes back up the fast pathway and when it gets to the top, it proceeds BOTH up to the atrium (resulting in a retrograde P-wave that is usually buried in the QRS), and down the slow pathway (which is no longer refractory because it has a short refractory period).  Every time it gets to the inferior junction it conducts to the ventricles, an every time it gets to the superior junction it conducts to the atria.  It goes around and around the two limbs.

To terminate this re-entrant rhythm, all you need to do is stop conduction in the pathways until the sinus node can take over again.  This can of course be done with vagal maneuvers, adenosine, verapamil, or electrical cardioversion.

However, if the SVT recurs, then brief interruption of conduction in the AV node, such as with adenosine, will only be a temporary solution.  Same with electricity.

Thus, in this case, we need to prevent initiation of the SVT, or use a drug that maintains prolonged AV blockade.  To do so, one can try to prevent the formation of PABs.  Beta blockers are pretty good at preventing PABs, and also at slowing AV conduction.


Further management

The plan was to load with a beta blocker, then convert again with adenosine if necessary, with the expectation that the beta blockade would prevent another PAB and the rhythm would remain sinus.  Additionally, it is also possible for beta blockade to convert the rhythm (in addition to preventing PABs) because it slows AV node conduction. 

Therefore, we started esmolol (500 mcg/kg) by bolus and drip (50 mcg/kg/min).  We chose esmolol because it is short acting and can be turned off if there are hypotensive complications.  There were no adverse effects (and no response either), so another 500 mcg/kg bolus was given, with increase in the drip to 100mcg/kg/min.  No response, so another bolus and drip was increased to 150mcg/kg/min.  There was still no response.

At this point I was sure that if we gave adenosine, the patient would convert and remain in sinus.

So we gave adenosine 6 mg.  He converted.  10 seconds later there was a PAB and her reverted to PSVT again.

What would you do now?

Now the patient needs either:

1) a drug that will block AV nodal conduction for longer than adenosine, and better than esmolol did at the given dose.  A calcium channel blocker such as verapamil or diltiazem would be good (In the era prior to adenosine, we used to give verapamil  regularly for PSVT, with good results).  There is some potential for significant negative inotropic events with these medications.  A word of caution: avoid use of both beta blockade and calcium channel blockade simultaneously.


OR

2) a drug other than a beta blocker to prevent a PAB


After reading the New England journal article above (while managing the patient), I was considering  either verapamil or ibutilide.  I called our consulting cardiologist and he suggested amiodarone, followed by adenosine to convert again.  Like beta blockers, amiodarone prevents the initiating beat.

We gave 150 mg of amiodarone over 10 minutes, then started an infusion.  The rhythm stayed  in SVT but slowed gradually to 130 then 120 beats per minutes, then converted spontaneously to sinus.

Here is the post conversion ECG:
There is now sinus rhythm.  The BBB is still present, so this was not rate related.

Outcome:

The patient did well.  He had an episode of atrial fibrillation, but spontaneously converted.   Ultimately, the SVT was controlled with metoprolol.


Lesson

1. SVT that recurs needs therapy to either block the AV node for a prolonged period (adenosine's effect is for seconds only), or therapy to prevent the PABs that initiate any recurrent SVT.


Dyspnea on Exertion and a Positive Troponin

$
0
0
A woman in her 50's complained of dyspnea on exertion for two days.  Her lungs were clear on exam.  Her first troponin I returned at 0.1 ng/mL (elevated, upper limit of normal = 0.30 ng/mL).   Here is her ECG:
Sinus tachycardia.  The QRS duration is 103 ms and there is some left axis deviation.  What is the likely diagnosis (before I give more clinical information)? -- See below


More data on this patient:

She only had a h/o well controlled AIDS and hypertension.  She had no fever or cough. Her oxygen saturations were 92% on room air.  On exam, she had clear lungs, normal heart sounds, and no peripheral edema.   A chest x-ray was normal.  A bedside echo showed "grossly normal function, good global contractility, no obvious wall motion abnormalities, no pericardial effusion and no B lines present in her lungs." They did not comment on the right ventricle.

The BNP was significantly elevated.  Hemoglobin and electrolytes normal.

Clinical course

After admission, a D Dimer was ordered and returned at 6x the upper limit of normal.  A CT pulmonary angiogram showed multiple bilateral superior and inferior segmental pulmonary arteries with central filling defects (extensive pulmonary emboli.)  There was leftward bowing of the interventricular septum consistent with right heart strain.

The clinicians were cognitively steered down the ACS pathway because of the elevated troponin, and also down the heart failure pathway due to the elevated BNP.  

However: This is a classic case of PE until proven otherwise:

1. When there is hypoxia with a normal chest x-ray, put PE near the top of the differential.  Also consider: hypoventilation (including low respiratory drive), vasodilators and sepsis (both of which cause shunting, with V-Q mismatch), and, most commonly, asthma.

2.ACS infrequently is associated with sinus tachycardia (usually when it is severe ischemia with cardiogenic shock and pulmonary edema)

3.  Positive troponins in unselected ED patients, especially at a low level, are more commonly due to demand ischemia than to ACS.  Think CHF, hypertension, sepsis, PE, etc.

4. BNP is elevated in PE as well as in heart failure, from right ventricular strain.

5.This ECG is classic for PE: 1) sinus tach 2) right ventricular conduction delay (R' in V1) 3) T-wave inversions in BOTH precordial leads and in lead III.  4) S1Q3T3 (a tiny R-wave in III is equivalent to a Q-wave).  (see the primer on the ECG in PE below)


I was sent this ECG without clinical information and asked what it was.  My first thought was "pulmonary embolism." All because of the above ECG findings.

Here are other cases of acute right heart strain:

Case 1
Case 2
Case 3 (is it acute right heart strain or not? -- with echocardiogram)
Case 4
Case 5 (with echocardiogram)


Primer on the ECG in Pulmonary Embolism:

These are findings of acute right heart strain, and could be seen in any condition which results in a rapid rise in pulmonary artery pressure. This includes hypoxia because of "pulmonary hypoxic vasoconstriction" 

The ECG is not sensitive for PE, but when there are findings such as S1Q3T3 or anterior T-wave inversions, or new RBBB, then they have a (+) likelihood ratio and the S1Q3T3, or even just the T3, may help to differentiate Wellens' from PE. 

Stein et al. found normal ECGs in only 3 of 50 patients with massive PE, and 9 of 40 with submassive PE.  Today, however, that number would be higher because we diagnose more of the submassive PEs that have minimal symptoms.

This is a paper worth reading: Marchik et al. studied ECG findings of PE in 6049 patients, 354 of whom had PE.  They found that S1Q3T3 had a Positive Likelihood Ratio of 3.7, inverted T-waves in V1 and V2, 1.8; inverted T-waves in V1-V3, 2.6; inverted T-waves in V1-V4, 3.7; incomplete RBBB 1.7 and tachycardia, 1.8. Finally, they found that S1Q3T3, precordial T-wave inversions V1-V4, and tachycardia were independent predictors of PE. 

What is an S1Q3T3?  Very few studies define S1Q3T3.  It was described way back in 1935 and both S1 and Q3 were defined as 1.5 mm (0.15 mV).  In the Marchik article, (assuming they defined it the same way, and the methods do not specify this), S1Q3T3 was found in 8.5% of patients with PE and 3.3% of patients without PE.

Kosuge et al. showed that, when T-waves are inverted in precordial leads, if they are also inverted in lead III and V1, then pulmonary embolism is far more likely than ACS.  In this study, (quote) "negative T waves in leads III and V1 were observed in only 1% of patients with ACS compared with 88% of patients with Acute PE (p less than 0.001). The sensitivity, specificity, positive predictive value, and negative predictive value of this finding for the diagnosis of PE were 88%, 99%, 97%, and 95%, respectively. In conclusion, the presence of negative T waves in both leads III and V1 allows PE to be differentiated simply but accurately from ACS in patients with negative T waves in the precordial leads."

Witting et al. looked at consecutive patients with PE, ACS, or neither. They found that only 11% of PE had 1 mm T-wave inversions in both lead III and lead V1, vs. 4.6% of controls.  This does not contradict the conclusions of Kosuge et al. that when T-wave inversions in the right precordial leads and in lead III areindeed present, then PE may indeed by more common.  In my experience, this is true, but needs validation in a study of similar methodology. Supporting Kosuge, Ferrari found that anterior T-wave inversions were the most common ECG finding in massive PE. 


ST Elevation and a Positive Troponin: Is it Myopericarditis or STEMI?

$
0
0
A 51 yo male smoker with no other CV risk factors and no previous heart disease presented to a hospital without PCI capability complaining of 1.5-2 hours of severe epigastric pain radiating to the shoulders.  He was diaphoretic and agitated.  He had been treated for "flu" manifesting as fever and sore throat for 5 days.  He was afebrile.  He had no pericardial friction rub.

Here is his initial ECG:

There is sinus rhythm with a QTc of 434 ms.  There is a possibly significant Q-wave in lead III. There is ST Elevation in leads I, II, aVF (+minimal in lead III) and V4-V6.  The T-waves are not definitely hyperacute, but also possibly slightly enlarged.  The ST vector is approximately 30 degrees, between leads I and II, opposite aVR, which has the most ST deviation (in this case, ST depression).  And it is towards V5.  There is no reciprocal ST depression in lead aVL (if there were, the ST vector would have to be greater than 60 degrees).  There is no definitely excessive PR depression.  There is ST depression in V1 also. Is there ST depression in lead V2?  There is some artifact and wandering baseline.  If there is ST depression in V2, it is very important.  There is no appreciable PR depression.
The obvious differential diagnosis here is inferolateral +/- posterior STEMI vs. Myo- or pericarditis (or baseline ST elevation -- early repolarization).

Favoring STEMI:  

ST depression in V1 and possibly V2.  One should never be confident in an ECG diagnosis of (myo-) peri-carditis if there is ANY ST depression.  There may be ST depression in localized (as opposed to the much more common diffuse) pericarditis, but this is relatively rare.

Favoring Myopericarditis: 

Absence of reciprocal ST depression in lead aVL. (In our study of 150 patients with inferior STEMI, 33 had ST elevation in leads V5 and V6 (inferolateral STEMI).  All of them had some ST depression in lead aVL). 

This is a very difficult ECG.  I always say that "you diagnose pericarditis at your peril" because, if there is no rub or effusion, and the ECG is not absolutely typical of pericarditis, and the clinical scenario is consistent with STEMI, then you must act as if it is a STEMI.

The best way to rapidly differentiate is to do a high quality echocardiogram or, of course, just go to  the cath lab.

Clinical Course

A stat echo showed no pericardial effusion, but technique was inadequate to find or exclude a wall motion abnormality.

The initial troponin I returned at 8 ng/mL.  (myopericarditis?  or STEMI?)


With suspicion of STEMI, the patient was promptly transferred to a PCI-capable hospital
(door-to-door time: 30 minutes) and had this ECG on arrival:
Now there is much less ST deviation.  This would be rapid evolution for myopericarditis, and more typical of a coronary thrombus (or spasm) that has lysed (resolved).


He underwent coronary angiography by a very experience angiographer which ruled out coronary occlusion and had normal coronary arteries.  However, there was no IVUS (intravascular ultrasound) to absolutely prove absence of extralumenal plaque with culprit).

After angiography the patient was taken back to the hospital where he first presented
and was treated as for myo-pericarditis with anti-inflammatories.  A repeat high quality echocardiogram showed minimal pericardial effusion in the posterior and lateral sides. There was no evidence of wall motion abnormality.

After angiography, troponin I peaked at 18.120 ng/ml with a rapid fall thereafter to 0.143 ng/ml on day 4.

Here is the ECG on day 2:


All ST deviation is resolved.  There is T-wave inversion in I and aVL.  This evolution is consistent with either myopericarditis or STEMI

And here is the ECG on day 3 (48 hours):
Unchanged

No MRI or biopsy was done to prove or disprove myocarditis.  There was a mildly elevated CRP and ESR.


STEMI with normal angiogram: Even in cases where there is significant intraluminal plaque, most of the plaque is extraluminal.  When there is no visible plaque on angiography (a "lumenogram"), there still may be much extralumenal plaque which can ulcerate, producing thrombus, which occludes the artery, resulting in ischemia and ST elevation, but then spontaneously lyses.  The ischemia resolves, the wall motion recovers, the angiogram shows no stensosis and possibly even no ulcerated plaque.  Only use of intravascular ultrasound (IVUS) would be able to demonstrate plaque.  Coronary spasm may also result in ischemia, ST elevation, and a normal angiogram.

Troponin: Does a rapid rise and fall of troponin indicate STEMI with reperfusion rather than myocarditis?  One would think so, but I have not been able to find any hard data on this.  I have seen many cases of purported, but not proven, myocarditis that had a rapid rise and fall.  As inflammation is a more constant process than ischemia and reperfusion, I would have guessed that it would have a more steady elevation of biomarkers.  Does anyone know?  The "state of knowledge" paper referenced above makes no comment on this.
In this study of 625 patients with presumed STEMI who had angiograms within 2 hours of the ECG, but not simultaneous with the ECG, 26 had completely normal angiograms. The final clinical diagnosis by 3 cardiologists (not by MRI or biopsy) was STEMI in 7 (1.2%) and myopericarditis in 5 (0.8%).  Normal angiograms (no stenosis at all) seem to occur in about 4.5% of patients with Non-STE-ACS, but they still have substantial subsequent morbidity (2% death or MI at 1 year; TIMI score stratifies them well)

Finally, there is this paper by Sarda et al. from JACC in which they studied 45 patients with apparent STEMI but with normal coronary arteries.  They used Indium scintigraphy to assess whether it was MI or myocarditis.  In 35 of 37 cases with adequate followup, it was myocarditis.  In 2, it was MI.  However, this article states that scintigraphy has poor sensitivity and specificity for myocarditis: "Current state of knowledge on aetiology, diagnosis, management, and therapy of myocarditis: a position statement of the European Society of Cardiology Working Group on Myocardial and Pericardial Diseases."

Was the initial management correct?  Yes.  This could have been STEMI and should be managed as such.  It still might have been STEMI.  The ST depression in V1 and V2 is particularly worrisome.  Had it been possible to get a high quality echocardiogram at the time of the ST elevation, and it had been completely normal, then it would have been reasonable to diagnose myopericarditis without an angiogram. 

What is the diagnosis?  Is it clearly and unequivocally myocarditis? The diagnosis can't be made for certain without MRI, biopsy or at least a pericardial friction rub.  There was an effusion later on echo, strongly supporting the diagnosis. Additionally, profound PR depression (or elevation in aVR) would be very supportive.


Complaint of Weakness. Alert. Hemodynamically Stable. What is it?

$
0
0
A male in his 60's, dialysis patient, complained of weakness.  He was alert and had no SOB or Chest pain.  BP was 85/57 with a pulse of 65.  Here is his ECG:

What is it?  See below.


This is pathognomonic for hyperkalemia and is nearly end stage, almost a complete sine wave morphology.  It seems miraculous that a patient can have this ECG and not be in profound shock, but it is true. 

He may die at any moment though.

His potasssium was 8.8 mEq/L.

There were access problems, but he did get insulin, glucose, bicarb, calcium gluconate, and albuterol, all while preparing emergency dialysis. The treatment resulted in the following ECG 36 min later:

Although still scary, it is now much better.  Are there P-waves?  Perhaps; I find it hard to tell.

After another hour and more treatment including more calcium, and still awaiting dialysis, this ECG was recorded, with a corresponding K of 6.6 mEq/L:
It appears slightly narrower, but still scary


The patient's level of consciousness deteriorated and he was intubated, taken for dialysis, and survived.  Here is his post dialysis ECG which is nearly identical to his baseline:


My next post will show another example of severe hyperkalemia with sine wave morphology.

Is This a Simple Paced Rhythm?

$
0
0
A very complex patient presented critically ill.  This was his initial ECG:

There are pacer spikes.  Is this a simple paced rhythm?


There is a paced rhythm with a sine wave, diagnostic of hyperkalemia.  The potassium was 6.8mEq/L.

He was aggressively treated for hyperkalemia.  Another ECG was recorded 42 minutes later:
The QRS is still very wide (about 250 ms), but substantially narrower.  


Here is a recent baseline ECG:
This has a rather long baseline QRS at about 180 ms, but not nearly as long as with the high K.


A paced rhythm with a duration of greater than 180 ms is very long and, if it is chronically long, it is associated with poor prognosis.  

When the QRS in paced rhythm is acutely prolonged, as in this case, all of the etiologies of prolonged QRS should be on the differential: especially hyperkalemia and sodium channal blocking drugs.


Prolonged chest pain and Intraventricular Conduction Delay similar to Left Bundle Branch Block

$
0
0


A 67 year old male with no previous cardiac history or risk factors woke up at midnight with right-sided chest pain. It was the "worst pain of his life," and it radiated around his ribs, through to his back, and up into his neck, all on the right side. He was profusely diaphoretic, nauseated, and he vomited twice. He took some aspirin which gave him some minor improvement in symptoms. He "toughed out" the night, and when his pain was still not getting better about 8 hours later, he asked his wife to take him to the ED.   

He arrived at about 8.5 hours after onset of symptoms, still with severe chest pain, and had this ECG recorded:
What do you think?


There was a baseline ECG available from 3 years ago:

What is your interpretation? What would you do at this point? See below for interpretations.


Interpretation of presenting ECG:
Sinus tachycardia at about 105 bpm. The computerized QRS duration is 120ms, qualifying this for an Intraventricular Conduction Delay.  It has morphology very similar to LBBB: there is a wide complex with dominant S waves in the anterior leads, so we presumably can apply the same rules as full-blown LBBB.

The treating physicians documented that this ECG is "Sgarbossa negative."  There is no concordant ST depression in V1-V3, and no ST elevation equal or greater than 5mm.  Is there concordant ST elevation?  This depends on whether the QRS is mostly positive or mostly negative in lead V5; if positive, then the ST elevation is indeed concordant..

Lead V4 alone would make this ECG "modified Sgarbossa positive"(reference 1, reference 2): it has a 3mm S wave with 2.5mm of ST elevation, making a STE/S ratio of 0.83.

How about lead V5?  The S-wave and R-wave are of nearly equal voltage; on the other hand, the S-wave is slightly wider than the R-wave. What matters most?  Is it the voltage?  Or is it the integral (area under the curve) that matters most?  In any case, the difference in voltage and in area is not great, and therefore there should be almost no ST deviation in that lead. 

Thus, leads V4 and V5 are diagnostic of STEMI.

Furthermore, one expects a small R-wave in V1 and V2 in LBBB.  Instead, there are Q-waves.  There is also a notch on the ascending limb of the S-wave in V2 and also slightly in V3.  These are reminiscennt of  "Cabrera's sign" (a notch greater than 50 ms on the ascending limb of the S-wave in one of V3-V5).  These are signs of previous MI, or of well developed "subacute" acute MI.  

All of these ECG findings, along with the clinical scenario, are all but diagnostic of a subacute STEMI in the setting of LBBB.

Initial troponin I was 50 ng/ml. Cardiology was summoned. They took him immediately to the cath lab, where they found an acute thrombotic 99% stenosis of the proximal LAD with TIMI 1 flow. There were also thrombotic lesions of the mid LAD and D1. They aspirated the thrombi and placed 3 stents at these lesions. No further troponin data was available.

Here is his ECG later that day:
T wave inversions in the anterolateral leads, consistent with reperfusion. Some ST elevation persists, but no longer meets any criteria. The QRS appears a little bit shorter than previous.

And here is his ECG the next day:

Still shows T wave inversions with persistent ST elevation.  This persistence may portend the development of an LV aneurysm.

He recovered well and was discharged several days later.

Should thrombolytics be given?

Thrombolytics are still recommended up to 12 hours after the onset of pain. (Sorry, no full text here: this is an analysis of thrombolytic trials from 1983-1993, and found that if pain has been present for 6-12 hours, then a mean of 18 lives were saved per 1000 patients treated with lytics vs. placebo).

The ECG is, in fact, an even better measure of acuteness of a STEMI.  

When there is subacute STEMI, the thrombolytic decision must be made carefully with attention to both risk and benefit.  This is a large anterior STEMI with persistent pain and ST elevation.  There are Q-waves, and the highly elevated troponin I confirms prolonged infarct.  ST elevation is still present, however, and T-waves have not yet inverted, so there is still significant salvageable myocardium at risk.  Depending on the patient's risk factors for bleeding, and on the door to balloon time for transfer to a PCI institution, thrombolytics may be indicated.  


Take Home Points:
 - the modified Sgarbossa rule is more sensitive than the original
 - even when the ECG doesn't have a perfect LBBB, if there is significantly abnormal depolarization with a wide QRS it must still follow the same rules of appropriate discordance and proportionality
-Signs of old or subacute MI may also be seen in the setting of LBBB

Cardiac Arrest: To the cath lab with ongoing chest compressions

$
0
0
A male in his 20's with no past medical history was found in cardiac arrest.  He had been complaining of chest pain.  Medics found him in ventricular fibrillation.  It is uncertain whether he had bystander CPR.  After one shock, he was in PEA, then VF again.  He had multiple doses of epinephrine and also amiodarone.

Of course he was undergoing chest compressions the entire time.  He had a King airway in place.

On arrival to the ED, approximately 50 minutes after arrest, he was still in full arrest.  A rhythm check showed asystole.  Chest compressions were continued with the LUCAS device.  He was intubated.  The ResQPod (inspiratory threshold device) was applied to the endotracheal tube to increase venous return and cardiac output.   He was given more epinephrine, bicarbonate, and calcium in a last ditch effort to resuscitate him.  End-tidal CO2 was 18-20, then improved to 30-40.

A rhythm check revealed a slow regular wide complex rhythm with ST elevation apparent on the monitor.  A cardiac ultrasound revealed no significant motion.   There was only a "flicker" of movement with each electrical complex. 

More Epi, bicarb, and atropine was given.  SpO2 was 80%. 

A 12-lead ECG was recorded at approximately 70 minutes after arrest:
There is a regular wide complex bradycardia at a rate of 37, with no visible P-waves.  The QRS has a right bundle branch block and left anterior fascicular block morphology.  This could be due to either: 1) an idioventricular escape from the posterior fascicle, or 2) a junctional escaped with RBBB and LAFB.  There is obvious ST elevtion in V2-V6 and uiin I and aVL, with reciprocal ST depression in II, III, and aVF.

[RBBB and LAFB, with STE, are associated with massive MI from left main or LAD occlusion.  See this incredible caseAnd also this amazing case of resuscitation after 68 minutes of CPR.]

Case continued:

Chest Compressions were continued.  The interventionalist was consulted.  The cath lab was activated and the interventionalist also recommended tPA until cath could be done (it was early AM, the team was not in-house, and angiogram/PCI would be delayed).  Bolus and infusion were started at about 80 minutes after arrest.

VBG at this time showed pH of 6.94, pCO2 72, bicarb 18 and 69% O2 saturation.  Lactate was 11.3 mEq/L.  Pulseox was mid 80s and etCO2 was 25 mmHg. 

Esmolol was given to help prevent further VF.  (See abstract below: esmolol may be beneficial for refractory VF.  I would be worried that it would be detrimental in PEA.)

The patient was transported to the cath lab at approximately 120 minutes after arrest, with LUCAS CPR ongoing.

Outcome:
Angiography showed occlusion of the LAD and it was opened and stented with a bare metal stent.  However, the patient never regained cardiac function.


Angiography and PCI during CPR


In this study from 2010, 11 of 36 patients who underwent PCI during LUCAS chest compressions survived neurologicially intact.

In this study from 2007, PCI was successful in all 11 patients, but only 3 of 11 survived the procedure and none of them were discharged alive.

Here is a nice summary of research on PCI during CPR, written by Ron Johannsen of Hennepin County Medical Center: They conclude:

"Currently available data do not support routine [my emphasis] activation of the catheterization laboratory for patients without ROSC, even if mechanical CPR is being performed. Whether use of the LUCAS™ or other devices will affect outcome is uncertain; we will have to await the completion of ongoing clinical trials. For patients with cardiac arrest in the catheterization laboratory, however, it seems reasonable to institute mechanical CPR when this is available. Alternatively, other means of cardiac support, such as early transition of patients to ECMO or assist devices, to allow intra-arrest PCI could be mobilized for selected patients."

Who should be considered for PCI during chest compressions, in my opinion? 

  1. Out of hospital arrest: Patients who:
    1. Have witnessed ventricular fibrillation arrest, especially if preceded by chest pain
    2. Receive bystander CP
    3. Are relatively young without comorbidities
    4. Are undergoing excellent CPR (e.g., LUCAS)
    5. Have short arrest to treatment times and can undergo immediate PCI.  
      1. This case had PEA
        1. But ventricular fibrillation was the initial rhythm
        2. Although there was PEA, it was unusual in that the electrical activity was very recognizable and organized and clearly due to STEMI.  
      2. The time from arrest to PCI was probably too long to expect a good outcome.
  2. ED arrest from STEMI/STEMI-equivalent: relatively young without comorbities, good compressions on LUCAS, or put on ECMO.
  3. Cath lab arrest


Fibrinolysis unlikely to be of benefit
tPA has not been shown effective for cardiac arrest, whether with PEA (suggesting pulmonary embolism) or otherwise.  It does not even decrease mortality due to STEMI-related cardiogenic shock.       


Utility of angiography and PCI in patients with ROSC:

Spaulding article on prediction of coronary etiology of arrest: http://www.nejm.org/doi/pdf/10.1056/NEJM199706053362302
84 patients resuscitated and had cardiac etiology, 60 patients with clinically significant CAD, 40 with occlusion, 9 of these had no ST elevation.  The only independent predictors of occlusion were ST-segment elevation (odds ratio, 4.3; 95 percent confidence interval, 1.6 to 2; P 0.004) and chest pain before the arrest (odds ratio, 4.0; 95 percent confidence interval, 1.3 to 10.1; P 0.016).  The presence of one of these two factors was associated with positive and negative predictive values of 0.63 and 0.74, respectively, and the presence of both with values of 0.87 and 0.61.  How expert were the readers of these ECGs at finding ischemia?

Successful angioplasty was the best predictor of survival:  the following factors were predictive of survival: absence of the need for inotropic drugs during transportation to the hospital (odds ratio, 3.6; 95 percent confidence interval, 1.1 to 11.8; P 0.03) and successful coronary angioplasty (odds ratio, 5.2; 95 percent confidence interval, 1.1 to 24.5; P 0.04).

In the study by Silfvast (1991), 78% of patients with ventricular fibrillation had "coronary disease" as the etiology.

Here is an outstanding powerpoint on the need for angiography and PCI after return of spontaneous circulation, written by Demetris Yannopoulos, who, along with Keith Lurie (here at Minneapolis Medical Research Foundation, associated with Hennepin County Medical Center and the University of Minnesota), is doing incredible bench research on cardiac arrest.  Here is an EMCrit podcast on their spectacular advances.

Which patients with ROSC after out of hospital arrest need immediate angiography/PCI? 

The case that Dr. Yannopoulos uses in his presentation to illustrate the "negative" ECG in a patient with arrest and LAD occlusion does, in fact, show ischemia: there is very suble STE in aVL and reciprocal ST depression in II, III, and aVF.  Many would miss this.  Very expert ECG readers would see it.

My guideline
  1. If another definite etiology of arrest is found, other than ischemia, angiography/PCI is not indicated.  
    1. If no other etiology is found, then patients with any of the following should go to PCI:
      1. Preceded by chest pain
      2. Ventricular fibrillation with no known prior cardiomyopathy or channelopathy
      3. Any ischemia on the ECG, as interpreted by a very expert reader.  
        1. Since most ECG interpreters are not veryexpert, then in most cases any patient without a known etiology should go to the cath lab 


Abstract on Esmolol, to be presented at Social Media and Critical Care 2014, Gold Coast, Australia:

Emergency Department Use of Esmolol in Refractory Ventricular Fibrillation

Brian Driver1David Plummer1Stephen W Smith1
  1. Hennepin County Medical Center, Minneapolis, MN, United States
OBJECTIVE
We describe the outcomes for patients receiving esmolol during refractory ventricular fibrillation (RVF) in the emergency department (ED).
METHODS
A structured chart review in an urban academic ED of patients between January 2011 and March 2013 who received esmolol with an ED diagnosis of cardiac arrest (CA), ventricular fibrillation, or pulseless ventricular tachycardia, excluding patients who received esmolol before CA or after sustained return of spontaneous circulation (ROSC).  Cardiac rhythms, CA management, timing of ROSC, and patient outcomes were recorded.
RESULTS
Six male patients met inclusion criteria; one was excluded because esmolol was administered after sustained ROSC.  Four of five patients had out-of-hospital CA; all had automatic mechanical chest compressions delivered by a LUCAS™ device.  All patients received repeated doses of epinephrine, amiodarone, lidocaine, sodium bicarbonate, as well as other adjunctive medications. Defibrillation was attempted many times for each patient prior to esmolol administration (median = 6.5, range 4-10). Some had temporary ROSC, but no patient had sustained ROSC after administration of these medications and defibrillation. All patients had a rhythm of VF at the time of esmolol administration. An esmolol loading dose and infusion of 500 mcg/kg and 50-100 mcg/kg/min, respectively, was subsequently administered to all patients.  One patient with incessant VF achieved temporary ROSC and three others attained sustained ROSC after the administration of esmolol with repeat defibrillation; two survived to discharge with excellent neurologic outcomes.
CONCLUSION
Beta-blockade should be considered in all patients with RVF in the ED prior to cessation of resuscitative efforts.

Pseudo High Lateral STEMI -- How not to be deceived by ST elevation in aVL

$
0
0
This ECG was shown to me with no other information:

My response was: this is normal variant ST elevation in I and aVL. 


"Why?" I was asked.  First, I will say that many of my interpretations are subjective, based on pattern recognition that is not always translatable into a rule.

But I believe I can at least partly transform my interpretation into a rule here:   Even though there is some minimal reciprocal ST depression in lead III, the ST elevation is in the setting of a well-formed R-wave in aVL.  Moreover, there is a proportionally (proportional to the R-wave) small T-wave.  T-wave size and morphology is at least as important as ST elevation in diagnosing MI.  Also, there are well-formed J-waves in I and aVL.

High lateral MI is the MI location that is most difficult to diagnose largely because the R-wave voltage in Lead aVL isoften very small, and thus any ST elevation or T-wave amplitude may also be small, though when scrutinized it is often proportionally excessive.  This does not apply here.  There is plenty of R-wave amplitude with which to judge the ST segment and T-wave.

There are no other findings on the ECG to support MI:

1. Lateral MI is frequently associated with posterior MI, but here there is no precordial ST depression

2. High lateral MI from first diagonal occlusion (D1) is frequently associated with ST elevation in V2.  Well there is indeed ST elevation in V2, but this is normal variant ST elevation:  if you use the Smith formula, STE60 V3 = 1.5, computerized QTc = 392, and R-wave amplitude is 10.5 mm; formula = 21.50 (significantly less than 23.4, so very unlikely to be MI).

3.  There is no ST elevation in V5 and V6.

Pretest Probability

If this were a person at risk for STEMI: risk factors, older age, crushing chest pain, I would highly recommend serial ECGs, immediate formal echo, etc.  But not cath lab activation.

In this case, as it turned out, the patient was less than 40, had no risk factors, and had primarily abdominal pain and vomiting. 

Certainly I would not obect to serial ECGs, but no more aggressive investigation is warranted.

Also, do not hesitate to consult someone with more expertise.  This is usually, but not always, a cardiologist

Outcome:

It turns out that the cath lab was activated, coronaries were normal, and the patient ruled out.

Unfortunately, this happened on a late in the evening, so that the cath team had to be called into the hospital and it was an unfortunate use of resources.

All serial ECGs were identical.  The patient ruled out by serial troponins.

Lessons

1. Use cath lab resources wisely, especially depending on your institution's own resources
2. Remember the importance of proportionality
3. Remember the importance of the T-wave in STEMI
4. Soft ECG findings should be more deeply scrutinized when the pretest probability is low
5. f you are worried, use other resources, especially immediate high quality echo, to look for wall motion abnormality.


Inferior STEMI? Read the ECG systematically.

$
0
0
Leads V1 and V2 appear to be reversed.  Otherwise, what is it?


This diagnosis may be obvious to some, but it is easy to let your eyes be drawn to the ST elevation in II, III, and aVF, with reciprocal ST depression in aVL.  Then one forgets to read the ECG systematically: rate, rhythm, intervals, axis, voltage, QRS abnormalities, ST segment, T-wave, U-wave.

If one is systematic, then before seeing the ST-T abnormalities, you will see the short PR interval and the long QRS, which is long because of a delta wave.

ST- and T-wave abnormalities must always be read in the context of the QRS.  An abnormal QRS (LVH, LBBB, RBBB, WPW, Brugada, Hyperkalemia, IVCD, etc.), or abnormal depolarization, leads to abnormal repolarization (abnormal ST-T).

In this case, all the ST-T abnormalities are due to the abnormal depolarization through an accessory pathway, producing a delta wave and abnormal depolarization.  Even without a delta wave and short PR interval, the voltage of this magnitude (LVH) could also produce such a pseudoSTEMI pattern.


The patient presented with chest pain and palpitations.  The ST-T abnormalities did indeed distract the treating physician, who felt embarassed at initially missing what to him/her in retrospect was obvious.

The mind plays tricks on us and so we have to read these systematically.

This is very important for radiographs as well.  In my experience, most misreads of radiographs are not from lack of knowledge, but from distraction, from missing the obvious because you are looking for something else or see something distracting.  This is frequently true of ECGs.

Here are some other examples of pseudoSTEMI due to WPW.

Incessant Regular Wide Complex Tachycardia

$
0
0
A male in his 50's presented after a witnessed syncopal episode. He reported multiple syncopal events over the last 1-2 months with increasing frequency, as well as recent fatigue.  He had a remote history of in-hospital cardiac arrest during surgery.  He had no anginal symptoms, no CP or SOB.  Prehospital tracings were concerning for monomorphic sustained regular wide complex tachycardia with repeated runs of bigeminy, and no clear evidence of a current of injury.

In the ED, he had VT on the monitor, and the following 12-lead ECG:
There is a regular monomorphic wide complex tachycardia with no P-waves. The computer measured the QRS at 126 ms, but it may be longer, depending on where the QRS ends, and that is not easy to ascertain.  There is left axis deviation and a large R-wave in V1: this is the RBBB-LAFB pattern and suggests either SVT with aberrancy of RBBB/LAFB, or VT with a focus of re-entry in the posterior LV, perhaps posterior fascicle.  A posterior fasciclar VT would usually have a relatively narrow QRS; if this is indeed 126 ms, that would be appropriate for posterior fascicular VT. 

It is most likely to be VT:  There is a large upright R-wave in aVR.  However, if the computer is correct, the QRS is not as wide as it should be for VT.  However, it could be fascicular.  Strongly supporting VT are the beats that follow the sinus beats; these are not preceded by P-waves (no sinus beat and no premature atrial beat either).  Therefore, the ectopic beats are ventricular.  And since the ectopic beat has the same morphology as the tachycardia, the tachycardia is almost certain to be VT.

Arguing against VT is the fact that RS wave in V3 has a duration of only about 80 ms from the start of the R-wave to the nadir of the S-wave (greater than 100 is expected in most VT) and that the QRS duration is short.  However, these would be expected in a posterior fascicular VT.  Fascicular VT, because it starts in the conducting system, looks more like SVT with aberrancy than it looks like VT.  It is also usually much more stable than standard VT (and this patient tolerated his dysrhythmia fairly well, was stable during this ECG, although it did result in syncope).

He was started on an amiodarone bolus and drip, with no response.  Then he was given several boluses of lidocaine and a lidocaine drip.  At a dose of 4mg/min, the VT stopped and the following 12-lead was recorded:
Ventricular bigeminy with couplets, all with the same morphology as the VT.  This proves that the first ECG is indeed VT, because the wide complexes here are definitely PVCs, (not PACs with aberrancy as there are no P-waves) and thus these are not supraventricular beats with aberrancy but definitely ventricular beats.


The patient was given Magnesium with a goal level of 2.5 mEq/L and K was targeted at 4.0 mEq/L. Aspirin, heparin and clopidogrel were given for suspicion of ischemic etiology.  Accordingly, the cath lab was activated.  Coronaries were normal.  Left Ventriculography showed a diffusely hypokinetic ventricle with dyssynergic contraction pattern. There were frequent PVCs during the injection. Visual estimated ejection fraction was approximately 30-40%.


The patient was transferred to the ICU post cath. He was continued on Amiodarone drip in addition to Lidocaine drip.  He had this ECG recorded:
Sinus rhythm with a slightly prolonged QRS

He continued to have high frequency ventricular ectopy with 30 beat runs of VT which were well tolerated. In the morning, he had a 30 beat run of monomorphic VT and then had an episode of severe bradycardia down to the 20's, with loss of pulses and need for brief CPR.  The patient was given 2 mg of atropine and was then transcutaneously paced for 5 minutes during which time he woke up and was alert.  He was sedated and intubated.  Etiology was not entirely clear, but amiodarone was suspected as partly to blame and it was stopped.  A transvenous pacer was placed.  He remained stable on a lidocaine drip.

Later, the patient went for EP study, and because it would be prolonged, he underwent general anesthesia.  No dysrhythmia could be induced under general anesthesia.  He was brought back awake the next day and dysrhythmias were inducible and able to be mapped.  It was found to be a posterior fascicular idiopathic VT.  It was successfully ablated.  The electrophysiologist did not think the bradycardia would be a persistent problem, so did not implant a permanent pacer, but did place a loop recorder to further study this problem.

A cardiac MR was done which showed normal LV function, RV enlargement concerning for possible arrhythmogenic right ventricular dysplasia (this is unlikely, as the VT was of LV origin).  There was no evidence of myocardial scar or edema.

Diagnoses:

1. Posterior fascicular idiopathic VT, ablated.  Temporarily best controlled with lidocaine.
2. Syncope due to #1
3. Temporary LV dysfunction due to dysrhythmia.


Here is another case of idiopathic posterior fascicular VT.

See this excellent full text article (Thakur RK et al.  Anatomic substrate for idiopathic left ventricular tachycardia. Circulation 1996;93:497-501.)

Pseudonormalization of Wellens' Waves

$
0
0
A male in his 60's complained of intermittent chest pain all day.  He was vague as to whether there was active chest pain, but it was definitely better at the time I talked to him.

Here is his initial ECG:
There is minimal ST elevaton and there are subtle T-wave inversions in V2-V5, highly suggestive of Wellens' syndrome
In Wellens' syndrome, the artery is open.  T-wave inversion, as I've pointed out countless times (and hope I'm not belaboring) is indicative of reperfusion of the infarct-related vessel.

BP was elevated, pulse lowered to 45.  He received ASA, Plavix 600mg, Heparin, and a Nitro drip.

As a matter of course, I ordered another ECG 15 minutes later:

The increasing T Wave inversion is Diagnostic of LAD ACS.


Once the diagnosis is made, the patient must go to the cath lab if pain cannot be controlled or the ECG shows any evidence of re-occlusion.  Re-occlusion is diagnosed by pseudonormalization of the T-wave (becoming upright).

The patient stated his pain was perhaps 4/10.

I ordered another ECG:
The T-waves are now upright and there is slightly more ST elevation (though this by no means meets "STEMI" criteria - these critieria are very insensitive for LAD occlusion).  If you apply the early repol/LAD occlusion formula (see sidebar Excel applet), using a computerized QTc of 413, the value is 26.6, which is significantly greateer than 23.4 and confirms the diagnosis of LAD occlusion.

I immediately activated the cath lab.  Because this was a highly unstable lesion, in discussion with the interventionalist, we gave a load and drip of eptifibated (Integrilin).

A bedside Echo of course showed an anterior wall motion abnormality.

His pain again subsided.

A 4th ECG was recorded, pain free:
Reperfusion T-waves are again present.


The artery is open again.

The patient went to cath and had a distal LAD 99% stenosis with thrombus and TIMI-2 flow.

Initial troponin I returned at 1.5 ng/ml.  Peak was 8.1 ng/ml.


Lesson:

1. Pay attention to T-wave inversions
2. Obtain serial ECGs
3. Patients with objective evidence of ACS whose pain and ECG abnormalities cannot be controlled must go for emergent PCI
4. LAD occlusion may be very subtle, with minimal ST elevation
5. T-wave inversion is a sign of reperfusion and open artery.
6. Normalization of T-waves in this context is "Pseudonormalization" and is diagnostic of re-occlusion


Ventricular Fibrillation During Echocardiogram, Then Spontaneous Reversion Without Defibrillation

$
0
0
A 47 yo male presented to the Echo Lab one day after being seen in the ED for syncope.  During the echocardiogram, the tech noted that the heart stopped.  The monitor showed ventricular fibrillation.  Before the patient could be defibrillated, he spontaneously reverted to an organzied rhythm:

Ventricular Fibrillation, then a period of asystole, then a slightly wide escape rhythm.  One might question whether this is polymorphic VT, especially torsade.  I have a very long strip and it is definitely ventricular fibrillation, also as read by an electrophysiologist.

This happened several times before other personnel arrived with resuscitative equipment.

A 12-lead ECG was recorded:

There is no significant ST elevation, but there is ST depression in I, II, aVL and V4-V6.  The QTc is 465 ms, just barely longer than normal and not enough to cause torsade.


So the question comes up: what did he ECG look like at presentation to the ED the evening before?  Here it is:
Note how there is significicant ST elevation in V1 and V2 that is not there on the top (next day) ECG.  Note also that the T-waves are very prominent on the ED ECG, unlike the next day ECG.  The ST depression was present at that time as well.


I applied the LAD Occlusion vs. Early Repol Formula to this ECG: 

STE at 60 ms after the J point = 0.5 mm, computerized QTc = 460 ms, and R-wave amplitude in V4 = 7 mm; formula value = 25.45 which is greater than 23.4 and indicates that this is probably not normal variant ST elevation.

When the two are compared, it becomes clear that the ED ST elevation and T-wave are pathologic.

The patient was having anterior transient ST elevation ACS (technically not MI, as many have admonished me!!) at the time of the ED visit.  Serial troponins were normal.


An angiogram showed "100%" mid-LAD but with very faint antegrade flow.  He also had severe 3-vessel disease and underwent CABG 2 days later and did well.  The artery was occluded or nearly occluded at the time of the ED ECG.  This was the etiology of the ischemia and ventricular fibrillation. 

Spontaneous reversion of V Fib:

Spontaneous reversion is a rare but documented cause of syncope.  Here is one case report.  I have spoken with two electrophysiologists who report seeing this in the electrophysiology lab.   Frequently, what appears to be ventricular fibrillation is really polymorphic VT, as the two appear very similar morphologicially.  More often, I am shows a strip of Ventricular fibrillation that along with an erroneous interpretation that it is "Torsade," even though the patient was pulseless and required defibrillation.  Torsade should only be diagnosed in the context of a significantly long QT on the baseline ECG.  465 ms is not long enough.  Also, this morphology does not look like polymorphic VT (either Torsade or non-torsade PMVT).


Diagnosis:

1. ACS with 100% LAD occlusion
2. Syncope
3. Ventricular Fibrillation with Spontaneous


Elderly woman in Shock. EKG from #smaccGOLD pre-conference EKG workshop.

$
0
0
We had a great pre-smaccGOLD EKG conference, with Louise Cullen moderating and featuring Ed Burns, Hussam Tayib, John Larkin, Roger Harris, Trevor Jackson.

The smaccGOLD conference was incredible and the conference will be in Chicago next year!!  May 20-22, and I suspect there will be another EKG workshop the day before (May 19).  I will be proposing an Emergency Cardiology workshop as well, so stay tuned for more.

Here is a great description of the conference:  http://rebelem.com/social-media-critical-care-smacc/


Participants brought there own ECGs, and this was one:

An elderly woman smoker with a couple days of intermittent chest pain presented in shock.  She had no past medical history and was on no medications.  She was delirious and agitated and required ketamine for sedation. 

Here is her ECG:
Is this VT?  Atrial Fib with RVR?  Sinus?  SVT?  And what about the QRS?  ST-T abnormalities?  See below.


Is this VT?  Atrial Fib with RVR?  Sinus?  SVT?  And what about the QRS?  ST-T abnormalities?

Answer: Sinus Tach with PVCs, RBBB, LAFB.  Subtle Antero-lateral ST elevation with inferior reciprocal ST depression.  Q-wave in V1 (QR where there should be rSR') suggests old or subacute MI.  This is a very dangerous combination and is almost always due to LAD or left main occlusion.

Analysis

These very abnormal ECGs must be approached systematically unless you are very experienced and have instant morphology recognition.  Even then you are best off verifying your recognition with a systematic approach:

1. rate
2. rhythm
   2a. Fast?
      i. P-waves?
      ii. Regular or irregular?
      iii. If irregular, regularly irregular or irregularly irregular?
      iv. Wide or narrow?
      v.  Is it constantly fast? Sudden changes in rate?  Gradual changes in rate?
      vi.  Are there premature beats?
   2b. Slow?
      i.  Are there P-waves
      ii.  Do P-waves conduct?
      iii. Are P-waves at regular intervals?
      iv. Are QRS at regular intervals?
      v.  Are P's and QRS associated?  (no block)
      vi. Are P's and QRS dissociated? (block vs. dissociation only)
      vii.  Is QRS wide? (Escape or BBB)

3. QRS
   3a. Axis
   3b. Intervals (QRS, QT: look for LAFB, LPFB, RBBB, LBBB, IVCD)
   3c. Voltage
   3d. R-wave progression
   3e. Q-waves
   3f. S-waves
4.ST-T-U
   4a. Voltage Proportional to QRS?
   4b. Appropriate/Inappropriate discordance/concordance to QRS?
   4c. T and QRS axis close to each other?
   4d. ST axis?


Here is an annotated ECG:
See full description below.  Black arrows point to P-waves that are hidden in preceding QRS but do conduct.  Red arrows point to easily seen P-waves.  These are easily seen because they follow a premature beat which does NOT reset the sinus node.  The blue arrow points to a P-wave that is hidden by BOTH the preceding T-wave and the onset of the following PVC.  The greenarrows point to premature beats.  Are they PACs or PVCs?  This is very difficult to ascertain: if PVCs, they have a remarkably similar morphology to the conducted (LAFB, RBBB) QRS; if PACs, where is the premature atrial activity and why does it not reset the sinus node?  My conclusion is that they are PVCs that originate from near the posterior fascicle. 


Here is a more systematic analysis:

1. the rate is 120
2. one can see P-waves (black, red, and blue arrows)
3. P-waves are regular
4. QRS is irregular, but Regularly irregular, with beats 3, 5, 12, and 19 coming early (PAC vs. PVC, I believe PVC, see above)
5. There is some P to QRS dissociation (also beats 3, 5, 12, and 19)
6. QRS is wide

QRS

Axis is left
End of QRS is where black lines are
QRS duration in about 160 ms
Q-wave in V1
There are Deep S-waves in II, III, aVF and V2-V6.
There is a large R-wave in aVL and V1
Thus, the QRS morphology is LAFB and RBBB

ST-T-U

The ST segment begins at the end of the QRS, at the black lines
There is ST elevation, see ST segment after black line in V2, V3, aVL


Outcome

Taken to cath lab and had a proximal LAD occlusion, arrested and was unable to be resuscitated.

Here are two other similar ECGs:

First one (one of my most popular posts ever)
Second one (an incredible resuscitation with great outcome and also very frequently viewed)

COPD exacerbation, what do the ECG and bedside echo show?

$
0
0
A woman in her 60s presented with a COPD exacerbation.  She also complained of some sharp chest pain with coughing. She was in moderate distress consistent with a moderate COPD exacerbation.  An ECG was recorded:

The computer reading was: "Anterior ST elevation due to early repolarization."

The treating physicians were alarmed by the first ECG due to the apparent hyperacute T-wave in V3.  They applied the LAD occlusion vs. early repol formula (see sidebar for excel applet and see previous posts), using computerized QTc of 416, STE60V3 of 3.0 (it may be 3.5) and R amplitude in V4 of 13, and found a value of 23.9 which is greater than 23.4 and indicates LAD occlusion.


So they sought out a previous ECG:

Here is one from 2 weeks prior:
What do you think?


Now they were even more worried, as the acute ECG is much different.  However, this patient did not have chest pain that was in any way typical.  They were appropriately reluctant to activate the cath lab, but did call the cardiologist, who was also appropriately worried.

A bedside ED cardiac echo was done during the evaluation:


First bedside ultrasound, subcostal view from Stephen Smith on Vimeo.

Here is an annotated still picture of one frame from above:
The blue arrow points toward the tricuspic valve and the base of the RV.  The red arrow points toward the mitral valve and the base of the LV


Second ultrasound, apical view from Stephen Smith on Vimeo.


What do these cardiac echo clips show?


First video clip: This clearly shows the bases of both the right and left ventricles are beating vigorously, but the apex is hardly moving at all.

Second clip: It is easy to see the base of the heart contracting, but although the image quality of the apex is poor, one does not see much motion there


At this point, the patient started having crushing chest pain and another ECG was recorded:
Now there is increased ST elevation in V3. Seeoutcome below.


A formal ultrasound with Definity contrast was being done at approximately the same time as the onset of severe chest pain.  It showed:

--Regional wall motion abnormality-distal septum anterior and apex akinetic, large.
--Regional wall motion abnormality-distal inferior wall akinetic.
--Regional wall motion abnormality-lateral akinetic.
--There good contractility of the base of the heart.


--Normal left ventricular size.

--Decreased right ventricular systolic performance severe.
--Regional wall motion abnormality-right ventricle .

Outcome

This ultrasound and the bedside ultrasounds show "apical ballooning", all highly suggestive of Takotsubo stress cardiomyopathy (which is likely to accompany a stressful event such as a COPD exacerbation), but it is also compatible with acute LAD occlusion.  The crushing chest pain, wall motion abnormalities, hyperacute T-waves and ST elevation were possibly due to takotsubo stress cardiomyopathy but also possibly due to LAD occlusion.  The patient was taken to the cath lab and had no obstructive LAD lesion and no culprit.  The troponin I peaked around 1.5 ng/ml.

Can one distinguish on the ECG between takotsubo stress cardiomyopathy (SCM) and acute STEMI???  Not reliably!  There are some ECGs that are clearly due to stress cardiomyopathy (widespread T-wave inversion).  But when the ECG is recorded during the ST elevation phase, I know of no reliable way to differentiate these.  I reviewed this topic in this post.  To sum it up very briefly, if it appears to be an infero-antero-lateral STEMI, it is more likely to be SCM than if the ST elevation is in one coronary distribution (e.g., anterior, as in this case); however, again, this is not more than 80% reliable.  The cellular pathophysiology of SCM is identical to STEMI (severe transmural ischemia), but it is due to catecholamine stress and small vessel constriction (NOT due to epicardial coronary flow obstruction); and that is why the ECG is nearly identical.

Here are several more cases of SCM.

Does cardiac ultrasound definitively differentiate the two entities?  In the acute phase, apical ballooning is highly suspicious for SCM, but large wall motion abnormalities may also be seen in patients with proximal LAD occlusion in a type III (wraparound) vessel, affecting anterior, lateral, and inferior walls.  These STEMI cases also have widespread ST elevation as in SCM.


Is the Right Ventricle involved in Takotsubo Stress Cardiomyopathy?

RV SCM has been described, appears to accompany LV takotsubo cardiomyopathy up to 25% of the time and be associated with worse LV function.   See this article: and also this article:
http://content.onlinejacc.org/article.aspx?articleid=1142735


Lesson:

There is no more vexing ECG mimic of acute STEMI than SCM because the underlying cellular pathophysiology is the same.  It is unusual to make the diagnosis without an angiogram.


Dyspnea, Chest pain, Tachypneic, Ill appearing: Bedside Cardiac Echo gives the Diagnosis

$
0
0
A male in his 60s presented complaining of dysnpea and chest pain.  He was tachypneic and ill appearing.

I was texted this ECG.  The physician worried about PE mostly, but also MI:
My response was: "incomplete RBBB.  No evidence of acute MI.  Certainly could be PE.  What does the cardiac echo show?"


Here is the cardiac echo:
chest pain and SOB, ill appearing, right bundle branch block from Stephen Smith on Vimeo.


Still frame of above video: Blue circle show thrombus snaking throughout right atrium and right ventricle.


The patient was given IV tPA and rapidly improved.  A subsequent ultrasound showed no more thrombus.

K. Wang Lecture: the Beautiful World of Electrocardiography. One hour.

Viewing all 1684 articles
Browse latest View live


Latest Images

<script src="https://jsc.adskeeper.com/r/s/rssing.com.1596347.js" async> </script>